Optical pressure mapping in microfluidic channels
Pressure is central to microfluidic operation, but measuring it locally often requires an embedded sensor that complicates fabrication or changes the device itself. Our approach uses the channel as its own sensing element: pressure deforms the transparent structure, and quantitative phase imaging measures this deformation without contact.
The first experiments resolved relative changes in channel radius below 0.1 µm, corresponding to an estimated pressure sensitivity of about 5 mbar in the deliberately compliant test device. The next step is to extend this calibrated measurement to more realistic microfluidic networks.
Measurement principle
Light accumulates a different optical delay when it passes through water and through polydimethylsiloxane (PDMS). Internal pressure expands a compliant channel, changing both its geometry and the optical path through the device. Quadrilateral lateral shearing interferometry records the resulting wavefront distortion as an optical-path-difference map.
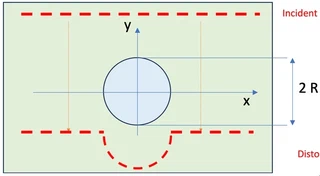
Pressure changes the channel cross-section and therefore the transmitted optical wavefront. Measurement principle from Acharya et al. (2026).
For a channel with known geometry and material properties, transverse phase profiles can be fitted with a mechanical model. The fit provides the channel radius and refractive-index contrast, from which pressure can be estimated after calibration.
What has been demonstrated
The phase images below show the same compliant channel with no applied pressure and at 1 bar. The wider optical-path profile at high pressure directly reveals the expansion of the channel.

Optical-path-difference map at 0 bar, extracted from Acharya et al. (2026).

Optical-path-difference map at 1 bar, extracted from Acharya et al. (2026).
In the proof-of-principle device, pressure ramps from 0 to 1000 mbar produced model-consistent changes in channel shape. The deliberately compliant PDMS channel reached more than 40% strain at the highest pressure, while relative variations in radius were resolved below 0.1 µm. Under those experimental conditions this corresponded to an estimated relative pressure sensitivity of about 5 mbar. The achromatic phase method also worked with ordinary white-light microscope illumination, and time-resolved measurements revealed the asymmetric response to positive and negative pressure steps.
These values describe the test device rather than a universal sensor specification. The response depends on channel geometry, material properties, imaging conditions and calibration.
Where the method could be useful
A non-contact, image-based measurement could map pressure at several positions in a soft microfluidic network without integrating a dedicated sensor at every point. This is relevant to lab-on-chip systems, organ- and tissue-on-chip experiments, nonlinear microfluidic flows and the characterization of soft transparent materials.
Limitations and current work
Quantitative pressure estimates depend strongly on mechanical calibration. PDMS stiffens with age, and fabrication variability, bonding, alignment and channel geometry all influence the deformation response. We are therefore working toward wider-field measurements, more complex channel networks and calibration strategies that separate pressure changes from changes in the opto-mechanical properties of the chip.
Working with us
Useful collaborations would bring demanding microfluidic applications, independent pressure measurements or expertise in soft-material mechanics. The project also offers student and postdoctoral work combining quantitative phase imaging, modelling and device experiments. Contact us if you have a system in which local pressure is important but difficult to measure.
Reference
K. Acharya, S. Monneret, M. Brandenbourger and T. Chaigne, Real time monitoring of pressure-induced deformation of PDMS to evaluate pressure distribution in microfluidic channels (2026 preprint).
